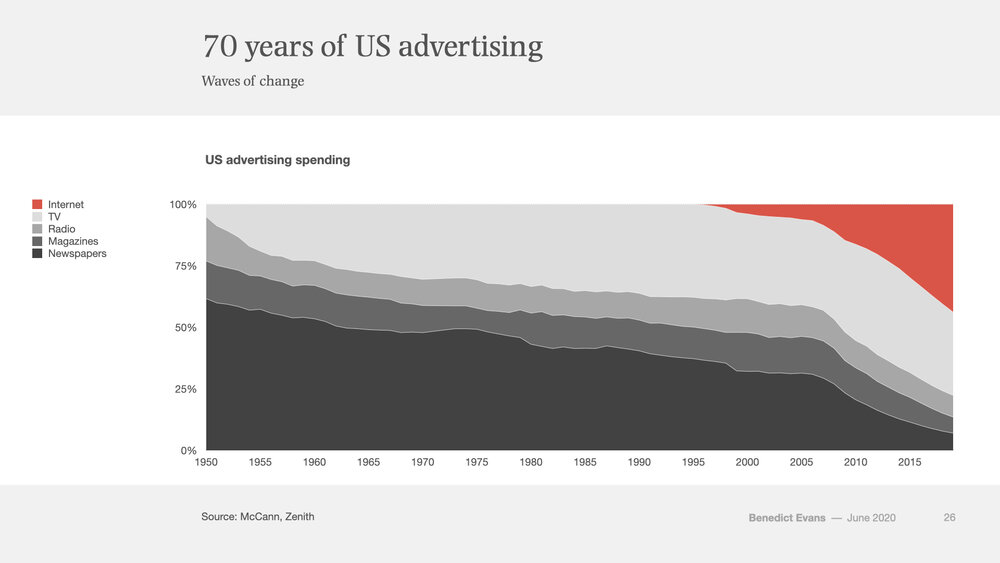
Interesting trends to note. Per the author, there was a slow taper from 1950 to the early 1970s, then a stabilization, but the decline starts again and runs until the Great Recession, when it picks up steam.
Almost all of that goes to the boob tube. Radio and mags stay steady, basically, until that late 2000-oughts period.
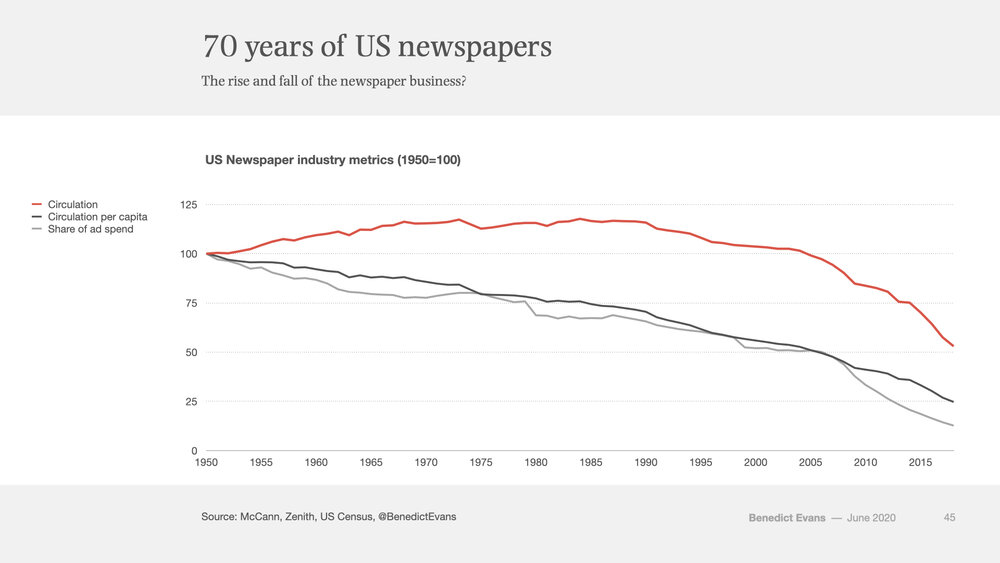
Here's a chart showing why that chart above starts in 1950:

Circ per capita peaked in 1950 and it's been all downhill since then. And, the resume of the slide in the first graph? That happened shortly before total circ peaked. You'll note that its decline also accelerated with the ad decline.
This chart combines the two:
So how did papers hang on that long? Benedict Evans says boosting page count to boost total ad sell, which papers that remained standing as more and more big city papers were going to just one daily, or at least losing one of the three or more they might have in really big cities, in the 1960s and early 1970s.
The Net hit hard when it was able to deliver quality as well as quantity on online ads, and undercut newspapers as what he calls a "light industry."
Look through the whole thing.
No comments:
Post a Comment